Prometheus
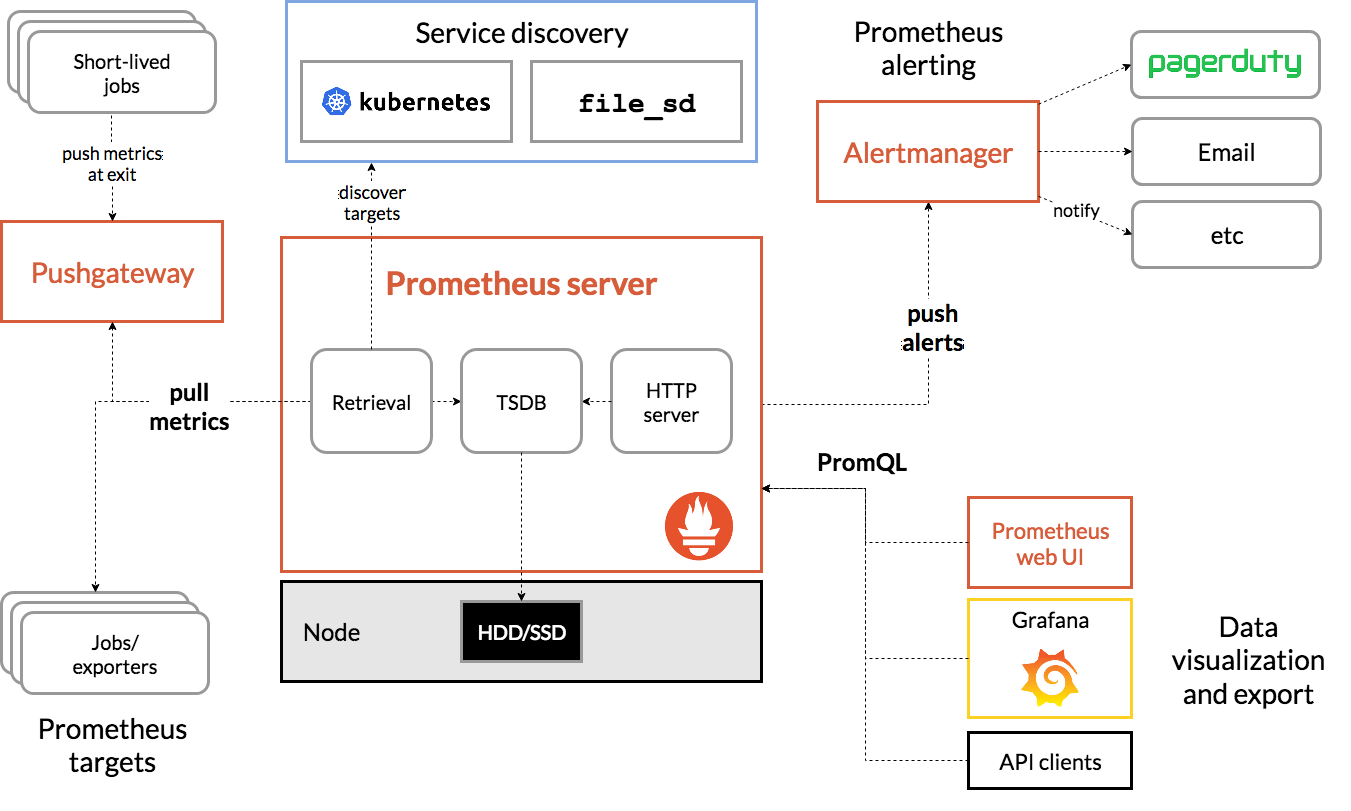
Prometheus内部主要分为三大块:
- Retrieval是负责定时去暴露的目标页面上去抓取采样指标数据
- Storage是负责将采样数据写磁盘
- PromQL是Prometheus提供的查询语言模块
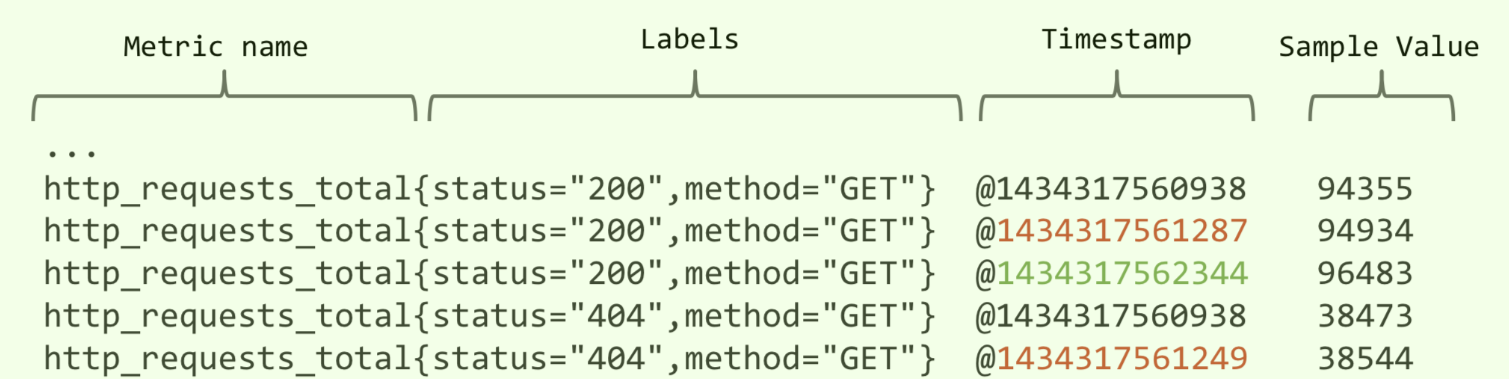
数据模型
- Metric name(指标名称):该名字应该具有语义,一般用于表示 metric 的功能,例如:http_requests_total, 表示 http 请求的总数。其中,metric 名字由 ASCII 字符,数字,下划线,以及冒号组成,且必须满足正则表达式 [a-zA-Z_:][a-zA-Z0-9_:]*。
- Lables(标签):使同一个时间序列有了不同维度的识别。例如 http_requests_total{method=“Get”} 表示所有 http 请求中的 Get 请求。当 method=“post” 时,则为新的一个 metric。标签中的键由 ASCII 字符,数字,以及下划线组成,且必须满足正则表达式 [a-zA-Z_:][a-zA-Z0-9_:]*。
- **timestamp(时间戳)**:数据点的时间,表示数据记录的时间。
- Sample Value(采样值):实际的时间序列,每个序列包括一个 float64 的值和一个毫秒级的时间戳。
业务侧实现一个接口,返回Prometheus规范化数据
1 |
|
运维侧部署的时候,在svc上带上3个标签
1 | annotations: |
prometheus.io/scrape:
自动采集指标数据开关,默认为false;Prometheus会在k8s集群中自动检测哪些svc是打开了这个开关
prometheus.io/path:
采集指标数据路径,默认为 /metricsprometheus.io/port:
采集指标端口,默认为pod暴露的端口
静态
部署在非Kubernetes中的服务。Alertmanager是没有部署在Kubernetes里面的。
1、业务侧实现接口,返回格式化监控数据。Alertmanager也自带监控接口,路径就是 /metrics
2、修改Prometheus-Server配置文件,新增加一个job_name静态配置。
prometheus.yml
prometheus.yml
# 全局配置
global:
  # 抓取间隔,单位为秒
  scrape_interval: 15s
  # 抓取超时时间,单位为秒
  evaluation_interval: 30s

# 抓取配置
scrape_configs:
  - job_name: 'prometheus'
    # 抓取目标的静态配置
    static_configs:
      - targets:
        - 'localhost:9090'

   - job_name: "alertmanager"
    static_configs:
      - targets: ['alertmanager.xxxx.com:80']

  - job_name: 'node_exporter'
    # 抓取目标的DNS服务发现配置
    dns_sd_configs:
      - names:
          - 'tasks.node_exporter'
        type: 'A'
        port: 9100

  - job_name: 'pushgateway'
    honor_labels: true
    # 静态配置的抓取目标
    static_configs:
      - targets:
        - 'pushgateway:9091'

# 警告规则配置
rule_files:
  - 'first_rules.yml'
  - 'second_rules.yml'

# 存储配置
storage:
  # 存储后端类型,通常是 Prometheus 的本地存储
  storage_backend: 'local'
  # 存储路径
  path: '/var/prometheus'
  # 保留时间,单位为秒
  retention: '30d'
组件
https://github.com/prometheus-community/helm-charts
1 | $ helm repo add prometheus-community https://prometheus-community.github.io/helm-charts |
Kube-state-metrics
https://github.com/kubernetes/kube-state-metrics#helm-chart
Kubernetes 集群上 Pod、DaemonSet、Deployment、Job、CronJob 等各种资源对象的状态的监控
metric-server
- metric-server(或heapster)是从api-server中获取cpu、内存使用率这种监控指标,并把他们发送给存储后端,如influxdb或云厂商,他当前的核心作用是:为HPA等组件提供决策指标支持。
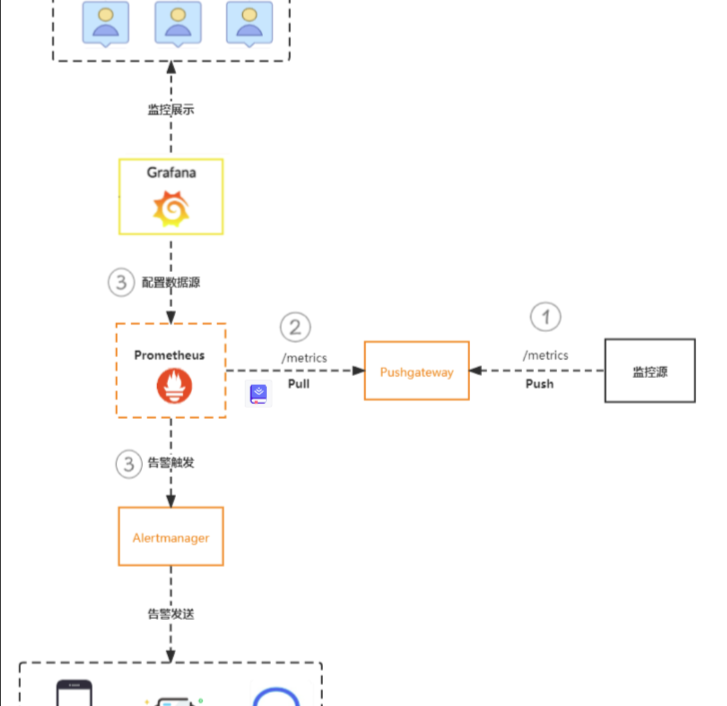
Pushgateway
该部件不是将数据push到prometheus,而是作为一个中间组件收集外部push来的数据指标,供prometheus进行pull
1 | scrape_configs: |
- scrape_configs: 这部分定义了 Prometheus 抓取指标的配置
job_name: 抓取任务的名称。static_configs: 定义了一组静态的抓取目标。每个目标包含一个或多个targets,通常是 IP 地址和端口的组合。honor_labels: 一个布尔值,指示 Prometheus 是否在抓取时保留推送到 Pushgateway 的标签。
Flink可通过配置此reporter直接将数据写入Prometheus
使用Flink ?
通过Pushgateway方式,Prometheus无法直接检测到监控源服务的状态,故此种方式不适用于监控服务的存活状态等场景
Pushgateway属于静态代理,它接收的指标不存在过期时间,故会一直保留直到该指标被更新或删除 此种情况下,不再使用的指标可能存在于网关中
如上所言,Pushgateway并不算是完美的解决方案,在监控中更多做为辅助方案存在,用于解决Prometheus无法直接获取数据的场景
举例中删除{job=“some_job”}数据的语句并不会删除{job=“some_job”,instance=“some_instance”}的数据。因为属于不同的Group。如需要删除{job=“some_job”,instance=“some_instance”}下的数据,需要使用
1
2
curl -X DELETE http://pushgateway.example.org:9091/metrics/job/some_job/instance/some_instance
1删除所有group下的所有metrics,启动pushgateway时需加上命令行参数–web.enable-admin-api
1
curl -X PUT http://pushgateway.example.org:9091/api/v1/admin/wipe
node-exporter
用于采集node的运行指标,包括node的cpu、load、filesystem、meminfo、network等基础监控指标,类似于zabbix监控系统的的zabbix-agent
rules
groups: 定义了一组告警规则,其中包含一个或多个告警规则rules: 定义了告警规则的条件、标签、注释、时间间隔等
alert: 告警规则都有一个唯一的alert名称expr : 告警表达式,当满足表达式的条件时会转发给专门的告警模块,如
alertmanagersup是Prometheus自带的在线变量,如果不在{}其中指定对应标识,那么所有的目标都会生效,如果想精准到某个目标就需要在{}指定对应的标识。上述例子可以看到vm-rule.yml文件中的告警条件里都是带{env="onLine"},它是对应prometheus.yml中的labels标识的
for: 定义触发告警的时间持续阈值,单位为秒。例如,如果设置为 5m,则表示连续 5 分钟满足告警条件才会触发告警labels: 定义告警的标签,可以用于对告警进行分类和过滤。上述中team在之后可以用于分组告警,指某类告警信息发送给指定的人annotations: 定义告警的注释,可以用于提供额外的告警信息description: 对告警的详细描述summary: 对告警的简要概述title: 告警的标题runbook_url: 运行手册的URLseverity: 告警的严重性级别status: 告警的状态value: 触发告警的值
jvm-rule.yml
1 | # severity按严重程度由高到低:red、orange、yello、blue |
grafana
1 | grafana cli admin reset-admin-password pwdxxx |
Deprecation warning: The standalone ‘grafana-cli’ program is deprecated and will be removed in the future. Please update all uses of ‘grafana-cli’ to ‘grafana cli’
添加模板id
13824
13332-kube-state-metrics-v2
14981 cordns
14518 Kubernetes Cluster Overall Dashboard
存储
PostgreSQL
Prometheus远端数据存储方案之PostgreSQL
https://blog.51cto.com/lee90/2446119
elasticsearch
prometheus remote write storage es
minio
minio | EXAMPLES:
minio | 1. Start MinIO server on “/home/shared” directory.
minio | $ minio server /home/shared 单机
minio |
minio | 2. Start single node server with 64 local drives “/mnt/data1” to “/mnt/data64”.
minio | $ minio server /mnt/data{1…64} 集群
minio |
minio | 3. Start distributed MinIO server on an 32 node setup with 32 drives each, run following command on all the nodes
minio | $ minio server http://node{1...32}.example.com/mnt/export{1...32}…….
1 | type: s3 |
配置
prometheus.yml
relabel_configs用于配置哪个目标需要被抓取,发生在指标抓取之前。metric_relabel_configs发生在指标抓取之后,写入存储之前。
排除指定ns
1 | - job_name: 'kubernetes-pods' |
对指定的 Namespace 进行过滤,具体方式是使用
not_regex进行过滤,如果不想监控多个 Namespace,则在- not_regex后面添加多个 namespace,中间用竖线(|)隔开即可。
监控指定ns
1 | - job_name: 'my-job' |
只监控名字为 “my-namespace” 的 Namespace 中的 Endpoints
error
prometheus一旦启动占用大量内存,原因是pushgateway积累了大量的数据会push到prometheus,需要手动清除pushgateway中的数据。
prometheus中日志会出现
‘level=info ts=2020-04-08T11:40:55.581381661Z caller=head.go:526 component=tsdb msg=“head GC completed” duration=286.757915ms’
其中duration正常的数值应该是1~2ms。
清除数据可以参考prometheus git的readme中的
1 | curl -X PUT http://pushgateway.example.org:9091/api/v1/admin/wipe |
是指删除pushgateway中的数据,跟promethues没有关系