debian安装
1
2
| $>sudo dpkg -i logstash-2.4.1_all.deb
$> dpkg -L logstash
|
win安装
service工具 nssm
配置
logstash.conf
1
2
3
4
5
6
7
8
9
10
11
12
13
14
15
16
17
18
19
20
21
22
23
24
25
26
27
28
29
30
31
32
33
34
35
36
37
38
39
40
41
42
43
44
45
46
47
48
49
50
51
52
53
54
55
56
57
58
59
60
61
62
63
64
65
66
67
68
69
70
71
72
73
| input {
file {
path => [ "F:/ELK/nginx-1.10.2/logs/access.log" ]
type => "nginx_access"
start_position => "beginning"
ignore_older => 0
}
file {
path => [ "F:/ELK/nginx-1.10.2/logs/access_json.log" ]
#codec => "json"
type => "nginx_json"
start_position => "beginning"
ignore_older => 0
}
}
filter {
if [type] == "nginx_access" {
grok {
patterns_dir => "F:/ELK/logstash-2.4.1/patterns" #设置自定义正则路径
match => { "message" => "%{NGINXACCESS}" }
}
date {
match => [ "log_timestamp","dd/MMM/yyyy:HH:mm:ss Z"]
}
}
if [type] == "nginx_json" {
json {
source => "message"
#target => "doc"
remove_field => ["message"]
}
if [@fields][ip] != "-" {
geoip {
source => "[@fields][ip]"
target => "geoip"
fields => ["city_name", "continent_code", "country_code3", "country_name", "ip", "postal_code", "region_name"]
database => "F:/ELK/logstash-2.4.1/ip/GeoLiteCity.dat"
add_field => [ "[geoip][coordinates]", "%{[geoip][longitude]}" ]
add_field => [ "[geoip][coordinates]", "%{[geoip][latitude]}" ]
}
mutate {
convert => [ "[geoip][coordinates]", "float"]
}
}
}
}
output {
if [type] == "nginx_access" {
elasticsearch {
hosts => ["127.0.0.1:9200"]
index => "logstash-nginx-access-%{+YYYY.MM}"
}
stdout {codec => rubydebug}
}
if [type] == "nginx_json" {
elasticsearch {
hosts => ["127.0.0.1:9200"]
index => "logstash-nginx-json-%{+YYYY.MM}"
}
stdout {codec => rubydebug}
}
}
|
1
2
3
4
5
6
7
8
9
10
11
12
13
14
15
16
17
18
19
20
21
| input {
file {
path => "/var/log/myapp/*.log"
start_position => "beginning"
sincedb_path => "/var/lib/logstash/.sincedb_incremental"
sincedb_write_interval => 15
}
}
filter {
# 添加过滤器配置,如解析日志等
}
output {
elasticsearch {
hosts => ["http://localhost:9200"]
index => "myapp-logs-%{+YYYY.MM.dd}"
# 如果使用ILM,可以添加ilm_policy
# ilm_policy => "my_ilm_policy"
}
}
|
使用sincedb数据库记录每个文件的读取进度
path 指定了要监控的日志文件的路径。start_position 设置为 beginning 表示Logstash会从文件的开始处读取数据。sincedb_path 指定了sincedb数据库的位置,用于记录文件的读取位置。sincedb_write_interval 设置了sincedb数据库的写入间隔,防止频繁的磁盘I/O。
1
2
3
4
5
6
7
8
9
10
11
12
13
14
15
16
17
18
19
20
| # 增量集群索引数据迁移到ES Serverless配置
input{
elasticsearch{
# 源端ES地址。
hosts => ["http://localhost:9200"]
# 安全集群配置登录用户名密码。
user => "xxxxxx"
password => "xxxxxx"
# 需要迁移的索引列表,多个索引使用英文逗号(,)分隔。
index => "kibana_sample_data_logs"
# 按时间范围查询增量数据,以下配置表示查询最近5分钟的数据。
query => '{"query":{"range":{"@timestamp":{"gte":"now-5m","lte":"now/m"}}}}'
# 定时任务,以下配置表示每分钟执行一次。
schedule => "* * * * *"
scroll => "5m"
docinfo=>true
size => 5000
}
}
|
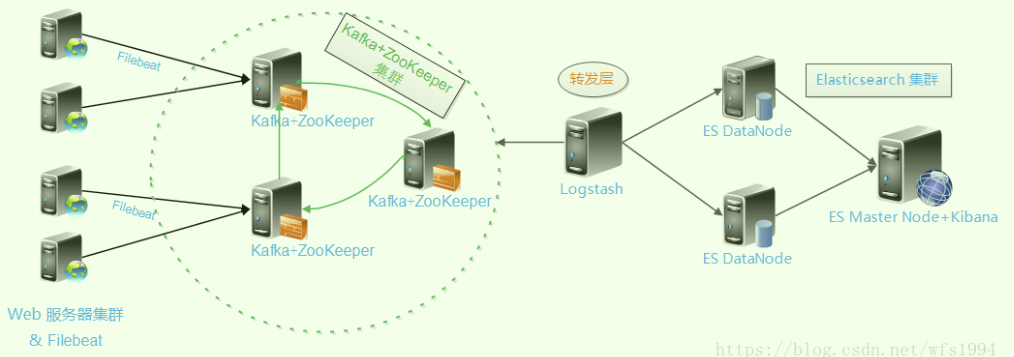
配置filebeat输出到kafka集群
1
2
3
4
5
6
7
8
9
10
| filebeat.prospectors:
- type: log
enabled: true
paths:
- /tmp/test.log
output.kafka:
enabled: true
hosts: ["192.168.20.201:9092", "192.168.20.203:9092", "192.168.20.56:9092"]
topic: 'test-log'
|
Logstsh从kafka读取数据
1
2
3
4
5
6
7
8
| input {
kafka {
codec => "json"
bootstrap_servers => "192.168.10.201:9092,192.168.20.203:9092,192.168.20.56:9092"
topics => "test-log"
consumer_threads => 2
}
}
|
filter
https://github.com/logstash-plugins/logstash-patterns-core/blob/main/patterns/ecs-v1/grok-patterns
1
2
3
4
5
6
7
8
| filter{
grok { match => [ "message", "%{TIMESTAMP_ISO8601:logdate}" ] }
date{
match=>["logdate","dd/MMM/yyyy:HH:mm:ss Z"]
target=>"@timestamp"
remove_field => 'logdate'
}
}
|
输入数据到kafka
1
2
3
4
5
6
7
8
9
10
| output {
kafka {
bootstrap_servers => "kafka-broker1:9092,kafka-broker2:9092"
topic_id => "my_topic"
compression_type => "snappy"
security_protocol => "SASL_PLAINTEXT"
sasl_mechanism => "SCRAM-SHA-256"
sasl_jaas_config => "org.apache.kafka.common.security.scram.ScramLoginModule required username='kafka_user' password='kafka_password';"
}
}
|
#Kafka输出插件
bin/logstash-plugin install logstash-output-kafka
logstash写入es速度太慢
- 调整Logstash的
batch_size和worker_threads设置:这些配置可以帮助Logstash更有效地批量发送数据到Elasticsearch。
- 优化Elasticsearch集群配置:
- 确保有足够的资源(内存、CPU)分配给Elasticsearch。
- 调整Elasticsearch的配置,例如增加
index.refresh_interval可以减少Elasticsearch的压力。
- 使用Filebeat代替Logstash:对于简单的日志转发需求,Filebeat可能是更好的选择,因为它更轻量级,速度更快。
点击打赏

会心一笑